
Final project - Scatter plot with different if qualifier for each variable

Final project - Scatter plot with different if qualifier for each variable

by Louise Wagensonner -
Number of replies: 3

1. Trying to make a scatter plot to observe early timepoint (4) for one variable "cd4_pd1" against another variable "wgt_base" at a later timepoint (48). I've been tinkering with this, but stata reads the second variable as invalid

scatter wgt_base if timepoint==48 cd4_pd1 if timepoint==4

2. Trying to represent the two tx groups from above overlaid as different colors. Following scatter code with ", by(tx_p1) just generates two separate graphs. Rather than copying the code twice for each group, is there a way to use ,by(tx_p1) for layering by group?
In reply to Louise Wagensonner

Re: Final project - Scatter plot with different if qualifier for each variable

by Eduardo Rodriguez Almaraz -

Hi,


You can't use two if statements on a scatter plot. Also, you need two variables to display your data on a scatter plot. Here is an example:


webuse nhanes2

scatter weight height if race==1 & sex==1, mcolor(green) || scatter weight height if race==2 & sex==2, mcolor(red) || lfit weight height if race==1 & sex==1, lcolor(blue) || lfit weight height if race==2 & sex==2, lcolor(red)

With this code you can overlay various groups but you need to label them properly.

Also, you need to modify the marker and line parameters to make them visible (size, color, trnasparency, etc) but that's the main idea.

In reply to Eduardo Rodriguez Almaraz

Re: Final project - Scatter plot with different if qualifier for each variable

by Louise Wagensonner -

Thanks Eduarrdo,

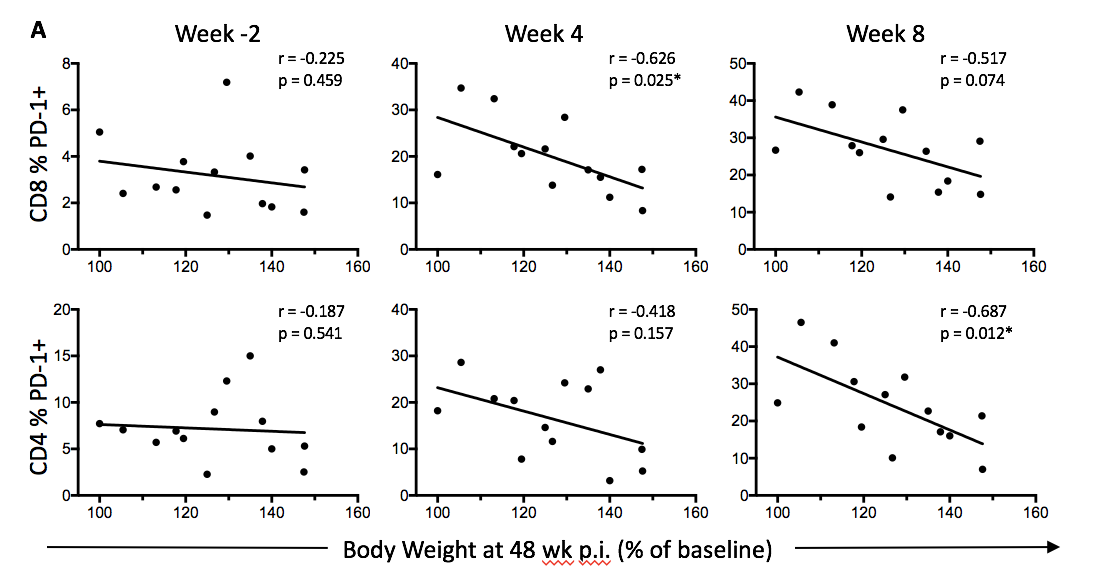
That's helpful, clear on the overlay aspect now, although I'm still struggling with trying to correlate variables at different timepoints. I want to see one variable at 4 weeks, vs another at 48 weeks. The idea is to ultimately generate something like the attached (done in Prism), just with groups a different color.

Maybe this is a database organization problem? I have only 16 'patients', but dozens of timepoints, so each patient/timepoint combo is a separate line/observation.

Attachment Screen Shot 2018-09-14 at 10.35.49 AM.png
In reply to Louise Wagensonner

Re: Final project - Scatter plot with different if qualifier for each variable

by Eduardo Rodriguez Almaraz -

Hi,

I think we would need to take a look at your data. But, I assume that you have your "time point" variable coded as 1,2,3,4,etc (or something similar). after you define your "scatter" line of code you can use the  "by" statement to create a plot similar to the above. For example:


webuse nhanes

scatter height weight, by(bmi_cat) // I recoded bmi cat in 3 groups and you have a plot like this


You should be able to combine the layering options provided in the previous response with the "by" option to get a plot that looks like this:

scatter weight height if race == 1 & race ==1, mcolor(green by (bmi_cat) || scatter weight height if race ==2 & sex ==2, mcolor(red)  by(bmi_cat)


The issue is if you have dozens of time points it will create dozens of graphs so I would suggest to create another variable that contains only the timepoints that you want so when you apply the "by" option creates only a few plots.


I hope this helps