Questions about profileplot/gr_edit/png2rtf (final)

Questions about profileplot/gr_edit/png2rtf (final)

by Shu Li -
Number of replies: 5

Anyone has any experience with the syntax profileplot and gr_edit? I used these two syntax and created a repeated measure plot graph, but encountered two problems:

1  when I tried to combine three graphs together, the yaxis and xaxis I had already changed returned to the original ones;

2 when I tried to export the graph and append it into the docx file I've made for table, nether gr export  nor png2rtf  worked.

3 name() and saving also failed after profileplot.

It would be great if anyone knows how to deal with these problems...


Thx


In reply to Shu Li

Re: Questions about profileplot/gr_edit/png2rtf (final)

by Amanda Irish -
Hi Shu, I'm not familiar with profileplot and only marginally familiar with gr_edit - that being said, can try to help you troubleshoot if you provide your code and errors. Without code it's hard for me to tell exactly what you're trying to do and what Stata is having a problem with.

Also, Stata has its own way to do repeated measures graphs called xtline which might be less problematic than using a user-generated command.

https://stats.idre.ucla.edu/stata/faq/how-do-i-use-xtline-in-stata/
In reply to Amanda Irish

Re: Questions about profileplot/gr_edit/png2rtf (final)

by Shu Li -

Hi Amanda,

Thank you for your replying. 

Here I attached my do file and dta file in attachment for you. It is a published data for intraoperative mannitol use. Brain tumor patients were infused with different dose of mannitol for brain relaxation during tumor resection and we did gas analysis at 6 time points to analyze the electrolytes disturbance caused by mannotil.

In table 1 I put baseline characteristics of patient and I want to merge 3 figures(concentration of Na+,K+ and glucose) for figure 1. I used profileplot make a graph and gr_edit to change labels of y-axis and x-axis. But I tried to use gr combine, but it failed. Also tried to save the graph in memory and saving/name/appen all failed.

Again, I just want to make my final project better, actually I've already finished version 1 for final project and this is version 3.

Thank you very much.

Shu

In reply to Shu Li

Re: Questions about profileplot/gr_edit/png2rtf (final)

by Amanda Irish -
Hi Shu,

Thanks for the additional info. A few comments:
1) It's fine for this project, but generally it looks like profileplot is intended for showing means of many different variables in the same plot, not the mean for the same variable over time - there are other commands that are better/more specific for longitudinal data. Again, don't worry about it for this project but just for your future work with this dataset.

2) I notice you name your graphs in the initial profileplot line, but didn't reference that name again - it's not wrong to do that, but you don't need to name the graph internally if you're not referencing it elsewhere, just FYI.

2) I would recommend using the putdocx commands rather than png2rtf to get your graph into word.

3) I'm still not sure what kind of error you were getting when you tried graph combine, but I was able to get it to work on my computer with the following steps:

cd "/Users/amandairish/Desktop/Biostat 212"

graph save nagraph
graph save kgraph
graph save glugraph

graph combine nagraph.gph kgraph.gph glugraph.gph, ///
rows(1) cols(3) ///
title("Mean sodium, potassium, and glucose concentrations") ///
xsize(10) ysize(4)

graph export "combined.png"

4) Also just a comment, not anything you did wrong, but will simplify and shorten your code a lot - all the graph edits you did can be done directly through the graph options, as follows with sodium as an example:

profileplot t0_na-t5_na, by(group) ///
ytitle("Plasma sodium concentration(mean)") ///
xtitle("Timepoint") ///
xlabel(1 "T0" 2 "T1" 3 "T2" 4 "T3" 5 "T4" 6 "T5") ///
name("Nagraph") //named for use with graph combine later, but could also save to disk if preferred


Hope that helps!
In reply to Amanda Irish

Re: Questions about profileplot/gr_edit/png2rtf (final)

by Shu Li -

Hi Amanda,

Thank you for your help. I tried the graph edits as you recommended, it's much simple and short. But I still have a problem for combining three graphs together. When I tried to combie three graphs together using graph combine , it only duplicated the last one three times in the combined graph.

Here are my codes:

/*Figure*/


clear


use data/mannitol_data.dta 


label variable t0_na "T0 Na"

label variable t1_na "T1 Na"

label variable t2_na "T2 Na"

label variable t3_na "T3 Na"

label variable t4_na "T4 Na"

label variable t5_na "T5 Na"


label variable t0_k "T0 K"

label variable t1_k "T1 K"

label variable t2_k "T2 K"

label variable t3_k "T3 K"

label variable t4_k "T4 K"

label variable t5_k "T5 K"


label variable t0_glu "T0 Glu"

label variable t1_glu "T1 Glu"

label variable t2_glu "T2 Glu"

label variable t3_glu "T3 Glu"

label variable t4_glu "T4 Glu"

label variable t5_glu "T5 Glu" //label variables for figure


net install profileplot.pkg, from(https://stats.idre.ucla.edu/stat/stata/ado/analysis)


/*figure syntax*/


********** Plasm Na+ concentration at different timepoint *********************

tabstat t0_na-t5_na, by(group) stat(n mean sd var)


profileplot t0_na-t5_na, by(group) ///

ytitle("Plasma sodium concentration(mean)") ///

xtitle("Timepoint") ///

xlabel(1 "T0" 2 "T1" 3 "T2" 4 "T3" 5 "T4" 6 "T5") ///

name("nagraph") ///

graph save nagraph ///

//named for use with graph combine later, but could also save to disk if preferred


********** Plasm K+ concentration at different timepoint *********************


tabstat t0_k-t5_k, by(group) stat(n mean sd var)


profileplot t0_k- t5_k, by(group) ///

ytitle("Plasma potassium concentration(mean)") ///

xtitle("Timepoint") ///

xlabel(1 "T0" 2 "T1" 3 "T2" 4 "T3" 5 "T4" 6 "T5") ///

graph save kgraph ///

name("kgraph") //named for use with graph combine later, but could also save to disk if preferred


// <end>


********** Plasm Glu concentration at different timepoint *********************


tabstat t0_glu-t5_glu, by(group) stat(n mean sd var)

profileplot t0_glu-t5_glu, by(group) ///

ytitle("Plasma glucose concentration(mean)") ///

xtitle("Timepoint") ///

xlabel(1 "T0" 2 "T1" 3 "T2" 4 "T3" 5 "T4" 6 "T5") ///

name("glugraph") //named for use with graph combine later, but could also save to disk if preferred


// <end>


graph save nagraph

graph save kgraph

graph save glugraph


graph combine nagraph.gph kgraph.gph glugraph.gph, ///

rows(1) cols(3) ///

title("Mean sodium, potassium, and glucose concentrations") ///

xsize(10) ysize(4)


graph export "combined.png", replace


And this is how it combined three graphs:
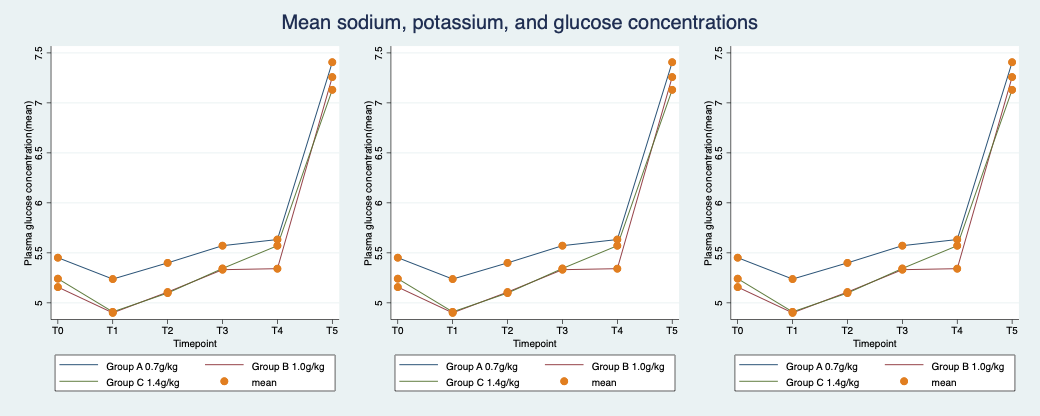
Combined graph, it is only the duplication of Glucose concentration.


Thank you for your help.

Shu

In reply to Shu Li

Re: Questions about profileplot/gr_edit/png2rtf (final)

by Amanda Irish -
Hi Shu,

Your problem here is the lines after your run the command to generate your glucose graph. For the save graph command, Stata just saves whatever graph is in its working memory, regardless of what you are naming it - so when you have the 3 commands to save together like that, “graph save nagraph”, “graph save kgraph”, and “graph save glugraph” after generating your glucose graph, Stata is saving your glucose graph 3 times under these different names. Your save command should only be directly after generating the graph you are trying to save.

As a note, you also don’t need to name the graph and save it; you can just do one or the other.

Hope that helps!
